Tomorrow marks the halfway point, calendar-wise, of the 2013 season. 3 months have passed, and 3 months have yet to play out. Soon some of the best players in baseball will be recognized for their first-half achievements through selection to the All-Star game. The trade deadline looms on the horizon, with the proverbial countdown clock officially set to 31 days and counting.
For today though, I wanted to look at the manner in which teams have been winning. Unlike other sports, players on a baseball team are distinctly separated into two groups, those who pitch, and those who don't. Everyone, other than the designated hitter in the American League, fields, and all except pitchers in the AL run the bases.
From the hitting side, 9 players hit on a regular basis for each team. Given that every team gets at least 27 plate
When will the "Year of the Pitcher" end?
 Do you know Stephen Loftus? If not, this will count as your introduction. Stephen takes a look at the current dominance of pitching, wondering when we can expect a change based on historical data.
appearances per game, and each starter can theoretically get 3 each, the weight gets spread around. A player who hits three solo home runs does incredibly well, but if the rest of the lineup produces all outs, the overall outcome is weak. If instead every other hitter in the lineup singled in each of his at bats, a few runs may score, but depending on the types of outs the other players make, that lineup could also produce a weak offensive output.
Rarely can one player on a team carry his club at the plate, it takes a solid effort from at least a couple of players over the course of weeks of games to score enough runs to win on a consistent basis. Despite this, given the midway point of the season, it's interesting to look at the most valuable position players from each team thus far, and get a sense of their contributions in comparison to their team's overall success or lack thereof. Here is a list of each team's current compiled position player fWAR and each team's top fWAR position player (For a more complete table visit this link):
fWAR | fWAR | ||
11.4 | Nationals | 3.2 | |
4.5 | 2.2 | ||
1.6 | 15.9 | ||
1.9 | 4.3 | ||
11.4 | Padres | 13.1 | |
3.2 | 3.6 | ||
9.3 | 6 | ||
2.7 | 1.9 | ||
11.2 | 11.3 | ||
1.8 | 3.2 | ||
9.6 | 9.2 | ||
4.2 | 2.1 | ||
Cardinals | 12.3 | 14.2 | |
3.7 | 4.3 | ||
8 | 16.5 | ||
1.4 | 3 | ||
10.2 | 11.6 | ||
3.3 | 3.3 | ||
9.1 | 11.5 | ||
2 | 3.9 | ||
14.6 | 7.9 | ||
3.2 | 1.8 | ||
12.5 | 14.1 | ||
2.9 | 5.1 | ||
3.3 | 5.4 | ||
2.7 | 3.5 | ||
0.8 | 1 | ||
2.2 | 2.3 | ||
4.3 | 4.4 | ||
3.8 | 2.6 |
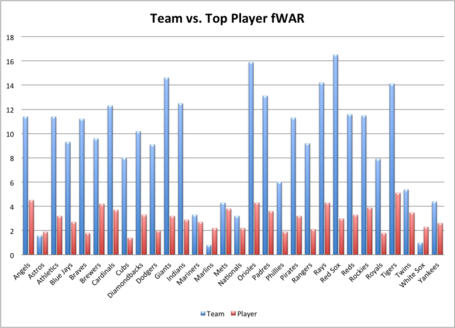
Most of these names are expected; league MVP candidates like Miguel Cabrera, Chris Davis, and Mike Trout lead their respective teams in value, garnering a sizeable percentage thus far. Low team position player fWAR does not imply poor results in the win-loss columns as proved by the Washington Nationals, a team underperforming their talent, but one that has accumulated wins due to their pitching, not their hitting.
Every position on the diamond other than pitcher is represented in the list of top players, highlighting the face that no one position dominates the game, especially when looking at overall value including fielding and base running. Some surprising names include Marcell Ozuna of the Marlins, Kyle Seager of the Mariners, Evan Gattis of the Braves, and Matt Carpenter of the Cardinals. Ozuna began the season in high-A Jupiter before making his way to Double-A, and finally to the majors as a fill in for an injured Giancarlo Stanton. Nonetheless, the young right fielder has compiled more fWins than the entire White Sox team; in fact it's more than double. Kyle Seager has followed a steady path upwards since his call up to the show improving in all three slash line categories, increased the rate at which he walks, all while limiting his strikeouts. Despite the numerous busts in the Mariners lineup this season, Seager has carved out a spot for himself in Seattle's lineup everyday. Matt Carpenter is the do-it-all man for the St. Louis Cardinals. He, like Seager, can play multiple infield positions, but instead of third base, Carpenter has found a home at second base, combining a near .400 on base percentage with a low walk rate of 13.3% to make himself a tough out for any pitcher. In addition, Carpenter has shown prowess on the defensive side with a 7.0 UZR/150, 5 DRS, and 1.3 FRAA in the field this season.
Now that we've perused the top position players, let's talk pitching.
fWAR | fWAR | ||
Angels | 4 | Nationals | 6 |
1.3 | 2.5 | ||
Astros | 3.2 | Orioles | 2 |
Bud Norris | 1.6 | 1.1 | |
Athletics | 5.4 | Padres | -0.3 |
Bartolo Colon | 2 | 1.7 | |
Blue Jays | 2.1 | Phillies | 6.5 |
0.7 | 3.4 | ||
Braves | 5.8 | Pirates | 4.2 |
1.8 | 1.4 | ||
Brewers | 0.9 | Rangers | 9.7 |
0.9 | 3.4 | ||
Cardinals | 9.8 | Rays | 4.8 |
4 | 1.3 | ||
Cubs | 7.3 | Red Sox | 7.4 |
2.5 | 2.9 | ||
Diamondbacks | 5.5 | Reds | 7.5 |
2.3 | 2.5 | ||
Dodgers | 4.6 | Rockies | 7.8 |
3.1 | Jhoulys Chacin | 2.3 | |
Giants | 3.1 | Royals | 5.3 |
1.6 | James Shields | 2.2 | |
Indians | 3.8 | Tigers | 13.4 |
2 | Max Scherzer | 3.3 | |
Mariners | 5.4 | Twins | 2.5 |
3.3 | 0.8 | ||
Marlins | 3.4 | White Sox | 7.1 |
1.6 | 2.6 | ||
Mets | 6.4 | Yankees | 8.1 |
Matt Harvey | 3.9 | 2.1 |
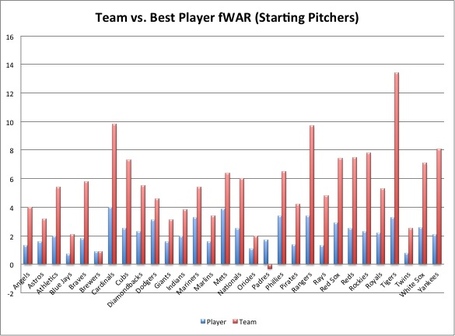
When it comes to pitching, a few teams distinguish themselves from the rest of the pack. The Tigers, Cardinals, Yankees, and Rangers all have winning records, and all currently or have at one point in the season held the top spot in their respective divisions, but they have done so through starting pitching. Tigers' righty Max Scherzer has compiled the same if not more fWins than numerous teams in the league. The Yankees may not occupy the top spot in the AL East, and have about as much money sitting on the DL as they do on the field, but between Hiroki Kuroda, C.C. Sabathia, Andy Pettitte, and others, the Yankees have kept the ship afloat. The Cardinals win in all aspects of the game, but none better than starting pitching. The Red Birds have three of the best pitchers in baseball in their rotation, Adam Wainwright, Shelby Miller, and Lance Lynn. The most interesting team of this bunch has to the San Diego Padres. The Friars stand just around the .500 mark, but have done so not with their trademark pitching, but instead in other aspects of the game. The Padres have the only negative pitching value in baseball at -0.3 fWins.
It's fascinating to see which teams have relied heavily on one or two specific players either in their lineup or rotation in order to win this season, which teams spread it out, needing only solid numbers from numerous players to compile victories. Teams win in different ways, and while most would like to have every player in their lineup play at a high level, some teams, like the Angels from a position player standpoint or the Phillies from a starting pitching standpoint rely heavily on one player in particular.
. . .
Big thanks to Fangraphs and Baseball Prospectus for the data used in this article.
Ben Horrow is a writer for Beyond the Box Score, That Balls Outta Here, and Summer Pastime.
You can follow him on twitter @Summerpastime.